EnergyNorth AmericaWorld
American energy use, in one diagram
How much energy we use, what kind, and how much is wasted.
Spring brings new growth, new possibilities, and, best of all, a new spaghetti diagram from Lawrence Livermore National Laboratory (LLNL) at…
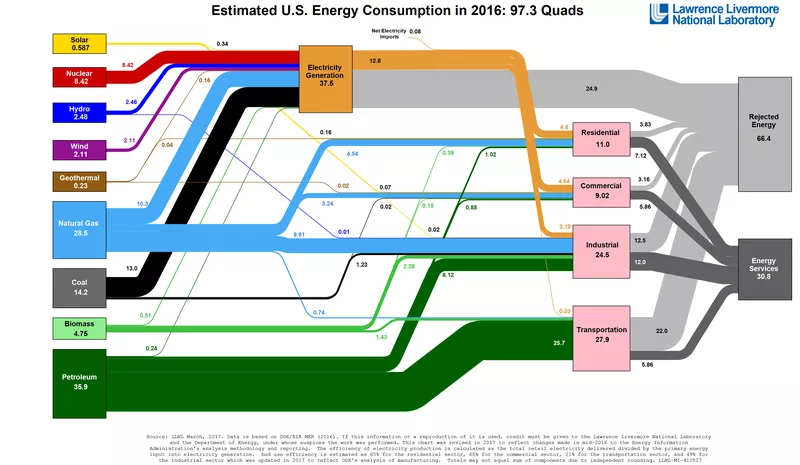 Every year, LLNL produces a new energy flow chart showing the sources of US energy, what it’s used for, and…
If you’ve never seen it…